haveged - A simple entropy daemon
Processor Flutter - Part 2
Additional analysis based upon the gnuplot data files described in part 1 is shown below.
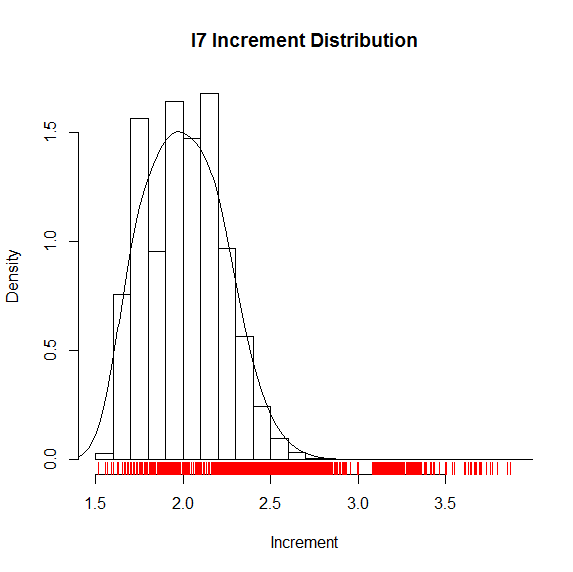
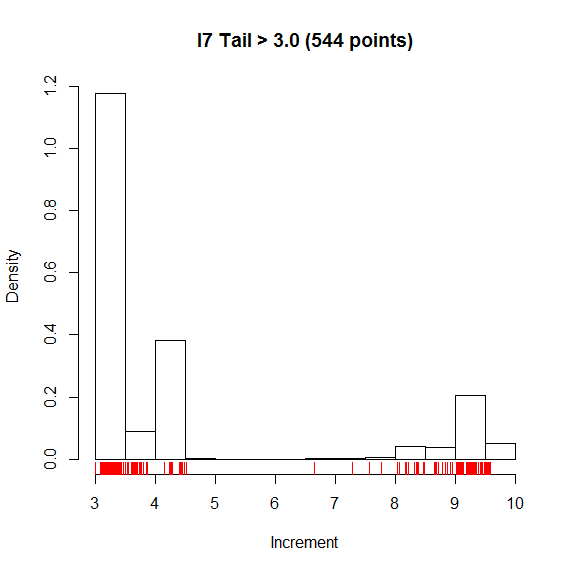
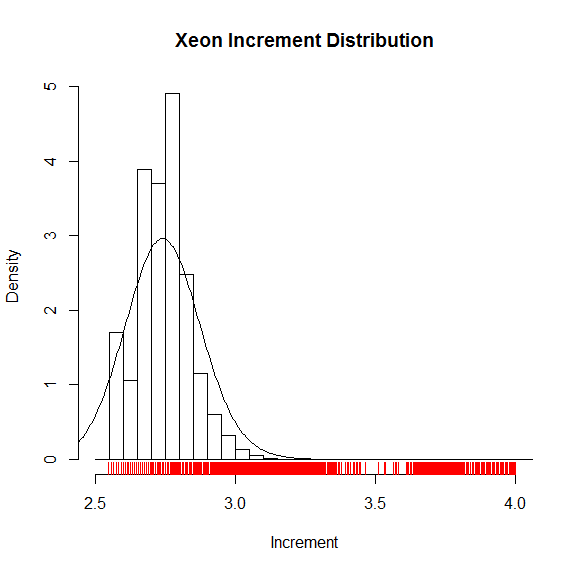
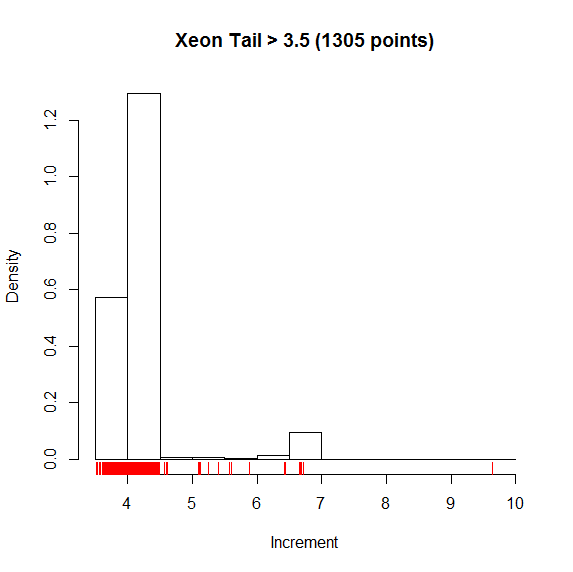
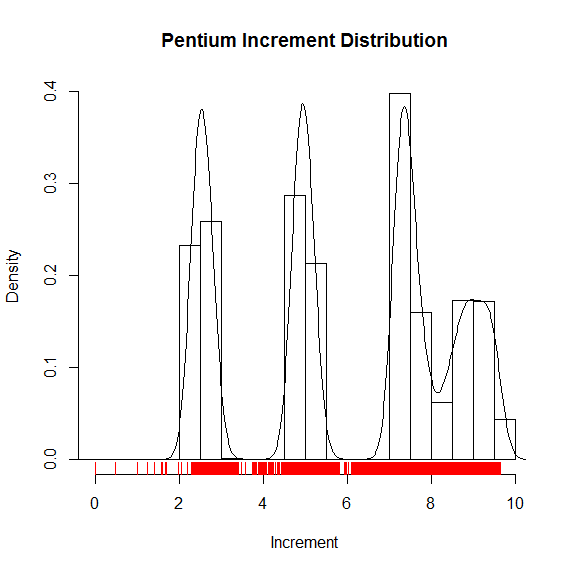
The first set of plots shows histogram plots of the difference data with a fitted density curve. The "rug" of each plot shows the same increment values previously shown in Part 1. The I7 and Xeon plots were divided into two ranges to provide better detail. Note that y scale for the "tail" plots is exaggerated by approximately 10^4.
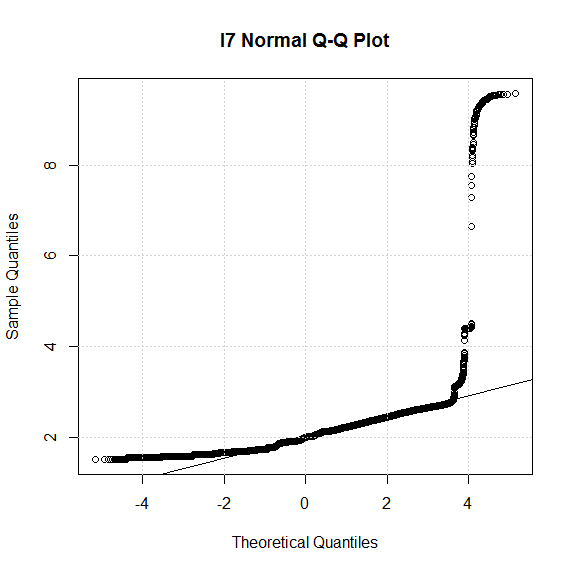
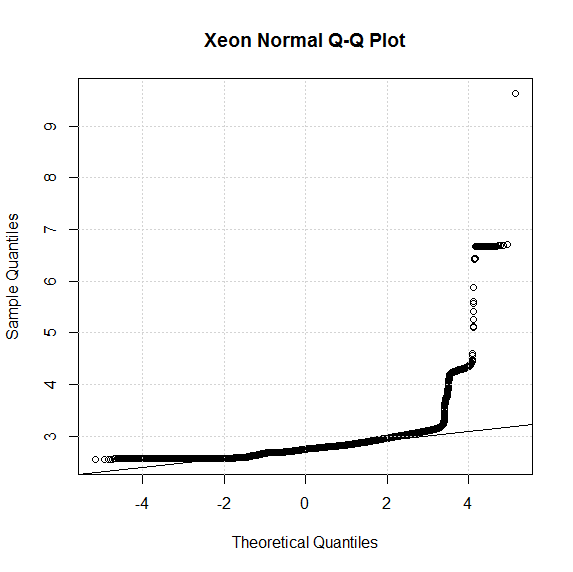
The bell-shaped density curves in the first two main plots suggest a comparision with a normal distribution. Data values are the logarithm of TICK differences, so the Q-Q Normal plots below show the fit of the data to a theoretical log-normal distribution.
The narrative continues after the exhibits.
Flutter Density
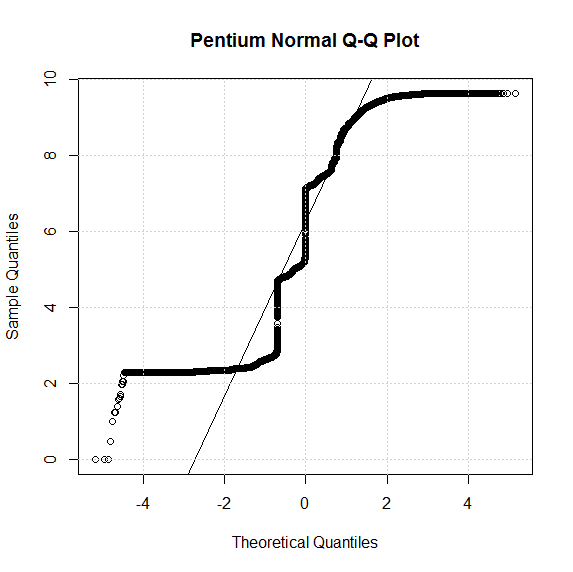
Q-Q Normal Plots
Discussion
The frequency plots show three peaks for each processor. For the I7 and Xeon, the last 2 peaks (the "tail") contain a miniscule portion of the population. In the Pentium case, approximately 75% of the distribution is concentrated in the tail.
To roughly paraphrase the Q-Q plots, the log data in the I7 and Xenon plots appears to be normal for more ~2 SD (standard deviations) on either side of the mean with excess population outside of that range. The Pentium plot is harder to interpret. Repeating the qqnorm plot for the Pentium data with the lower peak omitted (not shown) barely changes the shape of the plot and does not challenge the approximate plot shown. With some reservations, the data shown can be best described by a log normal distribution. By definition, the log-normal distribution is the maximum entropy probability distribution for a random variable for which the mean and variance of the logarithm are fixed.
A log-normal distribution is often thought of as the multiplicative product of positive independent random variables. Observed log-normal behavior in this case suggests that the haveged observed timer variations can be modeled as the product of independent random timer variations in the data/instruction cache, branch prediction cache, and the translation-look-asside cache.
Analysis of the log-normal hypothesis continues in part 3.